6a1e57656c636f6d6520746f20426c6f636b636861696e20416e616c79736973

Category: TRANSACTIONS

How are Ordinals impacting the transaction per second rate?

Since the introduction of Ordinals onto the Bitcoin network in January 2023 there has been criticism of them clogging up the network and resulting in higher fees for users. Large image files are often shown as examples of taking the majority of the size of a block but there are a large number of text based ordinals which consume significantly less space.

I consider the transactions per second throughput of the Bitcoin network from 2021 to the present to establish if ordinals were impacting the network.


Originally I intended only to consider 2022 and 2023 but on an initial review of the data the results were unexpected; the throughput was greater in 2023 despite ordinals being introduced. This is discussed later.


Mean Transactions Per Second

Month202120222023
January13.778.588.63
February13.417.9610.27
March14.958.5912.31
April13.129.3614.97
May10.578.8231.17 (Partial)
June9.848.73
July6.337.90
August7.128.41
September9.478.93
October8.907.42
November8.648.91
December8.728.86

Median Transactions Per Second

Month202120222023
January4.702.993.39
February4.713.104.05
March4.243.144.41
April4.053.174.97
May3.473.219.62 (Partial)
June2.853.12
July2.652.94
August2.822.98
September3.003.10
October3.253.08
November3.333.39
December3.183.17

To my surprise, the transactions per second have increased, on average, since the introduction of ordinals onto the Bitcoin network when compared to the same months in 2022. I extended my analysis to include 2021 to establish if this was consistent behaviour. The figures between 2023 and 2021 were more similar to that of 2022. I suggest that this is due to the bull market of 2021 vs the bear market of 2022 resulting in there being significantly fewer transactions on the network in 2022.

Reviewing the mempool transaction account chart on Blockchain.info lends support to this.


Considering the results, the conclusion appears to be that ordinals haven’t negatively impacted the transactions per second throughput of the Bitcoin network, however, it must be considered that this is during a bear market. If the ordinals remain popular during the next bull market where transaction volumes increase there is a realistic prospect of the network becoming saturated leading to higher transaction fees and longer waits for users before transactions are included in a block.


Note the above figures are based on inverting negative time values where a higher block is timestamped before the previous block. This is discussed in more detail in https://blockchainanalysis.co.uk/bitcoin-transactions-per-second-tps/. Furthermore, this is based on the embedded timestamps within the blocks which may not be accurate; see https://blockchainanalysis.co.uk/bitcoin-block-time-consistency/
Bitcoin RPC Genesis Block Oddity

Much of my research is based on commands to which Bitcoin Core RPC server responds. Through playing with the RPC server I noticed an odd quirk in it concerning the genesis block.

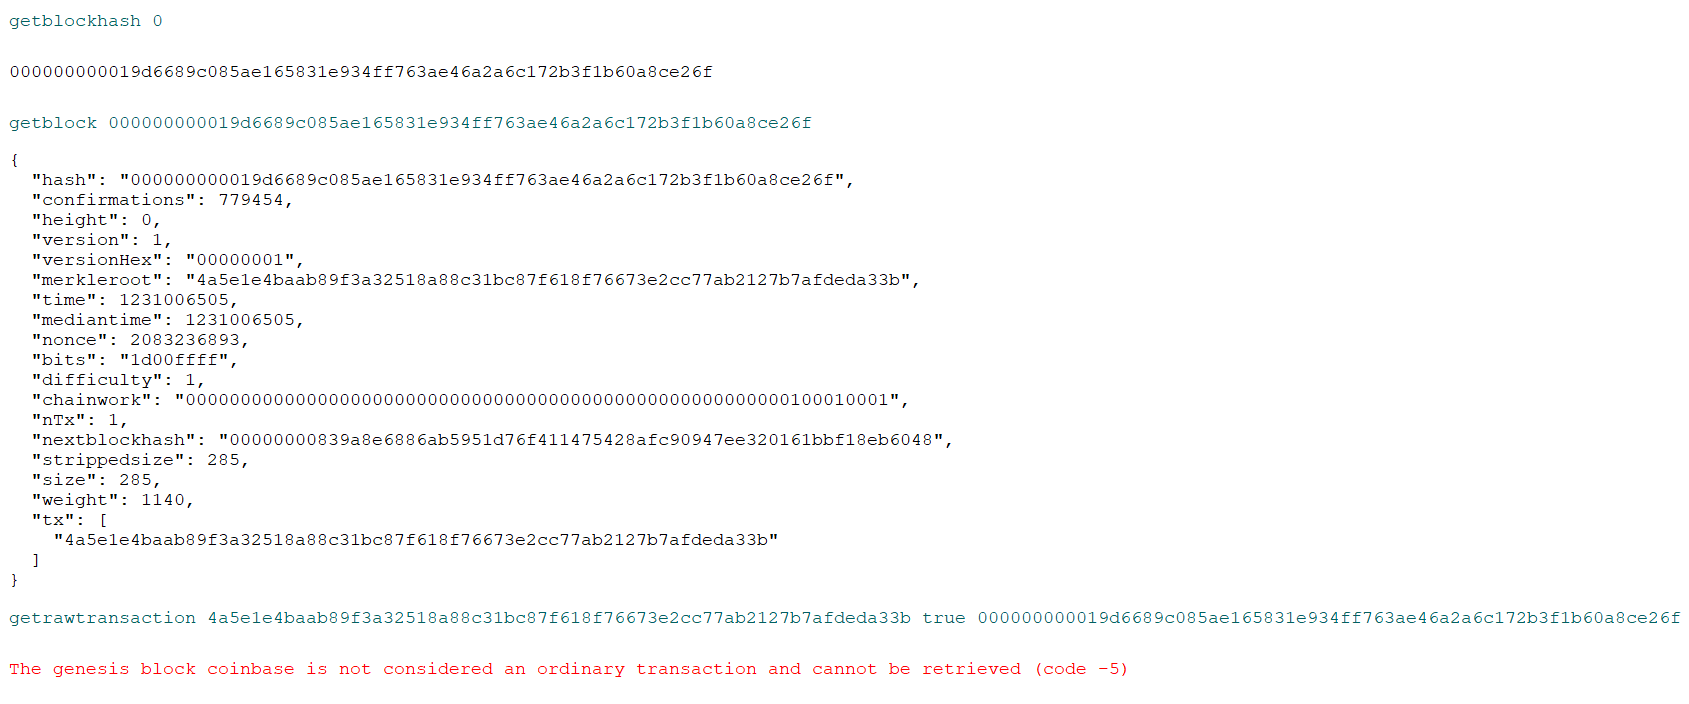
The genesis block can be requested with ‘getblockhash’ 0, returning the block hash 000000000019d6689c085ae165831e934ff763ae46a2a6c172b3f1b60a8ce26f which in turn can be requested with ‘getblock’ or ‘getblockheader’ which correctly returns the block information, and the former provides the single transaction hash present in the genesis block; 4a5e1e4baab89f3a32518a88c31bc87f618f76673e2cc77ab2127b7afdeda33b.

On any other transaction the command ‘getrawtransaction’ can be used on a transaction hash to expose the raw transaction data but for the genesis block transaction, the server responds to this command with ‘The genesis block coinbase is not considered an ordinary transaction and cannot be retrieved (code -5)’.

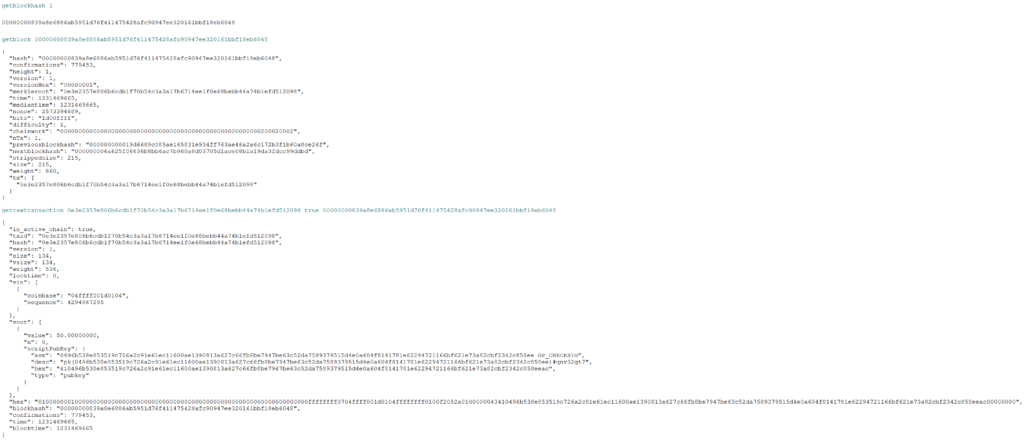
The image below shows the query log of the genesis transaction vs that seen in the second block.

SegWit Adoption

In the previous post I touched upon SegWit and how it was used to fit almost 4MB of data within the 1MB block size limit present in Bitcoin.


SegWit was introduced to the Bitcoin network in 2017 and removed (segregated) the witness data from the transactions’ inputs and moved them to a separate structure within the blockchain. This had the effect of reducing the block size requirements for transactions (and therefore the often the transaction costs) and protecting against transaction malleability.

The move also brought in a means to increase the storage potential as seen in the previous post relating to ordinals of around 3.9MB being stored on chain. This is due to a move from bytes to Work Units (wu) for calculating the size. Since the SegWit update, blocks are limited to 4 million weight units, with 1 byte in a legacy transaction being 4wu, but 1 byte in a SegWit transaction being 1wu.

Native SegWit addresses can be identified as starting bc1 on the mainnet, or tb1 for the test net. P2SH (Pay to Script Hash) addresses can also be used for SegWit transactions which start with ‘3’.

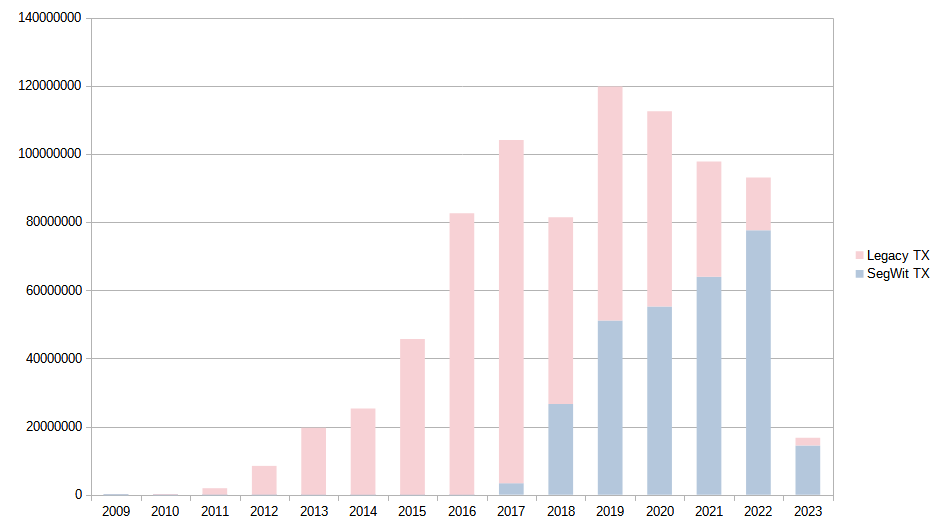
The adoption of SegWit for transactions appears pretty rapid, perhaps not unexpected given the savings made in fees by users. In 2018, approximately 1/3rd of transactions used SegWit. By 2019 this was around 43% and by 2022 approximately 87% of transactions used SegWit. Impressively, in 2023 SegWit usage appears to continue to rise with 86.5% of transactions using SegWit.


The table below summarises the quantity and percentage of SegWit transactions each year.

YearNo of
SegWit

Transactions
No of Legacy
Transaction
s
Total No of
Transactions
Percentage
SegWit
Percentage
Normal
2009032708327080100.00
201001853051853050100.00
20110190176519017650100.00
20120845305084530500100.00
2013019643241196432410100.00
2014025263720252637200100.00
2015045674023456740230100.00
2016082626623826266230100.00
201733742151006890141040632293.2496.76
201826599771547958658139563632.6867.32
2019510861026869754511978364742.6557.35
2020551791305737436811255349849.0250.98
202163919480338769739779645365.3634.64
202277594859155115199310637883.3416.66
20231444662522544831670110886.5013.50

Bitcoin Block Size

In my previous post (Bitcoin – Transactions Per Second (TPS)) I used data from Bitcoin Visuals’ website (bitcoinvisuals.com) to identify the average Bitcoin transaction size in recent years.

Since writing that post I have found that the Bitcoin RPC server responds to the ‘getblockstats‘ command. The response includes various parameters including:

  • ‘avgtxsize’ – the mean average transaction size within the requested block
  • ‘maxtxsize’ – the maximum transaction size within the requested block
  • ‘mediantxsize’ – the median average transaction size within the requested block
  • ‘mintxsize’ – the minimum transaction size within the requested block
  • ‘swtotal_size’ – the total size of all segwit transactions within the requested blockchain
  • ‘total_size’ – the total size of all non-coinbase transactions

By using this command we can easily identify the typical size of transactions on the Bitcoin network.


The (mean) average transaction size since the genesis block is around 590 bytes, and the (mean) average of the block median transaction sizes is around 265 bytes suggesting that relatively few very large transactions are responsible for skewing the mean average.

Without additional information as to each transaction’s size which, as far as I’m currently aware, would require querying each individual transaction it is difficult to identify these outliers. The ‘getblockstats‘ command does, however, expose the maximum transaction size for each block.

Earlier this year, on 1st February 2023, the Bitcoin network saw the largest ever single transaction in block ‘774628’. This transaction was a whopping 3938383 bytes (3.9MB) occupying the majority of the available block space. Some may have noticed that this exceeds the 1MB block size limit, however, this was a SegWit transaction therefore its contribution to the block size is not counted in the same manner.

Further investigation of this transaction found that it was related to Bitcoin ordinals and the reason for it being so large is the entire JFIF image is embedded within the witness data. The ordinal can be seen here.


As an aside, the transaction was large enough to crash Bitcoin Core’s ‘decoderawtransaction’ command. Fortunately, some of the online decoders (but not all!) managed to decode the transaction.


A further 2 transactions have been over 1000000 bytes, both in February 2023. These were blocks 776884 and 777945 and the large transactions were both related to ordinals(776884 and 777945).

Before 2023, the largest transaction was in 2015 when block 364292 contained a transaction just under 1MB in size. This appears to be very large due to the number of addresses (5569) all sending 1000 satoshis to a single Bitcoin address (transaction hash bb41a757f405890fb0f5856228e23b715702d714d59bf2b1feb70d8b2b4e3e08).


Getting back on track, the table below provides a summary of the average block sizes.

Year2009201020112012201320142015
Average TX Size10.13140.13445.42476.81526.36638.45794.79
Year2017201820192020202120222023 (partial)
Average TX Size622.29808.31533.21690.68867.07853.391309.37

This would give an approximate average TPS over the past few years of between 1.95 to 3.13 (2017 to 2022) based on the mean average transaction size, and each block being the target 10 minutes.

Bitcoin – Transactions Per Second (TPS)

Transactions per second (TPS) is an important metric when comparing Blockchains and features in the Blockchain trilemma (security, scalability, decentralisation). Bitcoin is heavily criticised for its low throughput which is often suggested to be approximately 7 transactions per second. This would equate to approximately 4200 transactions of around 250 bytes in each block (based on a 10-minute block time). This size of the transaction appears optimistic given recent average transactions, meaning the actual performance is lower.


The Bitcoin network’s TPS is frequently compared to VISA, with a figure of 24000 oft-cited for their payment service. VISA themselves claim a capacity of 65,000 transaction messages per second (it is unclear if each transaction required more than one message). It is important to note that this is a suggested capacity of their network, not how many occur. Based on VISA financial reports, the average (mean) transaction throughput in recent years was between approximately 4500 (2020) and 6100 (2022).

But I digress…


The typical calculation for a Blockchain’s throughput is (block size/transaction size) / block time

In Bitcoin, in its current configuration (as based on target block time), this would be (1MB / transaction size) / 600.

The transaction size on the Bitcoin network is variable and therefore this isn’t a constant. Bitcoin Visuals (bitcoinvisuals.com) assesses the average Bitcoin transaction size in recent years (2017 to 2022) to be between 455 and 636 bytes. This would equate to a transactions throughput of between 2.75 and 3.84 transactions per second based on the target 10-minute block time.

As I’ve written previously, the 10-minute block time is a target and is most frequently beaten. This has an impact on the calculation of transactions per second. There are instances where blocks are found within a second of the previous block. If the mempool (where pending transactions wait to be included in a block) is full, or near capacity at this time then the spot transactions per second value could be very high.

I reviewed the block headers for all blocks up till block 772089 (15th January 2023) and calculated the spot transactions per second for each block. In instances where a block was recorded as being mined earlier than its predecessor, the time difference was considered as a positive value.

Since the genesis block, Bitcoin has achieved approximately 5.7 transactions per second on average. The peak value I identified was 3087 transactions per second when block 572037 (16:02:17 17th April 2019) contained 3087 transactions, and was mined within 1 second of block 572036 (16:02:17 17th April 2019). It should be noted that this is one of the examples where the block height is positive, but the higher block is recorded as being mined earlier than the lower block emphasising the problems with the timing on the Bitcoin network.

The highest ‘non-negative’ time was in 2020 when block 649548 contained 3058 transactions and was mined one (1) second after block 649547 resulting in 3058 tps.


The table below summarises the last 12 years; in each of these years, there was at least one transaction a day.

Year201120122013201420152016
Max140387652766821.831795
Block Height of Max155293203685224618323678364691442517
Average (Mean)0.150.711.371.512.706.17
Year201720182019202020212022
Max285627863087305829402398
Block Height of Max465972549076572037649548687073752998
Average (Mean)13.057.9314.9713.6610.868.71

If negative time values are ignored, rather than being inverted, the figures change slightly. These results are summarised below:

Year201120122013201420152016
Max42278558766821.831382
Block Height of Max133623191425216547323678364691442239
Average (Mean)0.130.611.231.332.335.88
Year201720182019202020212022
Max285624933041305829402398
Block Height of Max465972556417565275649548687073752998
Average (Mean)12.077.2513.3012.8110.378.54

The increase in TPS from 2017 is expected, in part, the introduction of segwit to the Bitcoin protocol. By moving the witness data out of the block this allowed more transactions to be fitted within the 1MB block size.

Based on my previous experimentation with the accuracy of block timing where the average time between time in the block header and the time identified on my full node was 21 seconds then despite the findings above, they may not represent the throughput of the Bitcoin network. For example, if the timestamp of block 572037 was off by 21 seconds, then the TPS would go from 3087 to just 140. Still significantly higher than the expected throughput but lower than the summary figures would suggest.

Empty Bitcoin Transactions

During my usual browsing of various resources this morning I spotted an article on Cointelegraph entitled “You don’t see that every day: Empty Bitcoin block found”. This piqued by interest and in true ‘trust but verify’ mentality I thought I’d look into how frequently this occurs.


The Cointelegraph article focuses on block 776,339 which was the most recent zero transaction as of the time of the article. Since then there has been another zero transaction at block 776,521.

At the time of writing (17:00 14th February 2023) so far in 2023 there have been 13 blocks with no transactions (other than the coinbase) present in them; 770100, 770404, 770952, 771087, 773011, 773329, 773966, 774234, 774486, 774845, 775654, 776339 and 776521.

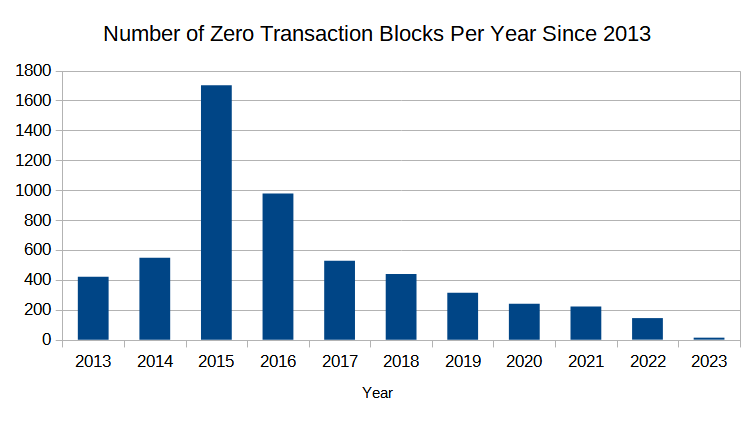
Since the genesis block, there has been a total of 89,453 blocks with zero-transactions. This is greatly influenced by the first two years which account for 88% of the zero-transaction blocks. Overall approximately 11.5% of blocks have contained no transactions, but in recent years this has been consistently under 1%.


The table below provides the total number of zero transaction blocks per year since the genesis block.

Year20092010201120122013201420152016
Number of Zero
Transaction Blocks
3231146489358515264205471701977
Percentage99.4568.456.012.800.660.933.131.78
Year2017201820192020202120222023 (Partial)
Number of Zero
Transaction Blocks
52843831424022114413
Percentage0.940.800.580.450.420.270.19

The graph below shows the last 10 years:


In writing this I noted that the Cointelegraph article reports that prior to block 776,339 the previous empty block was 774,486 a little over two weeks before. In analysing empty blocks I noted that there were two blocks closer to 776,339 which were empty (blocks 774,845 and 775,654). I’ve e-mailed the Cointelegraph editor and hopefully this will be corrected.

EDIT: The author reached out to me after my e-mail but as of 26th February 2023 the article remains uncorrected.