6a1e57656c636f6d6520746f20426c6f636b636861696e20416e616c79736973

Author: TM (Page 1 of 2)

A change of host

Previously this blog was hosted on IONOS’ managed WordPress service. After a couple of years of poor performance and price increases I moved to hosting to Amazon Web Services (AWS) which have provided good availability and performance for other services I host. The transfer was conducted without downtime, with the transition of the DNS entries being the final step to direct visitors to AWS rather than IONOS. This seamless transfer meant that my uptime tracker captured the change beautifully and the performance difference is readily apparent; around 1/4 of the time for the homepage to load on the new host.


In the main, the transfer was successful in retaining all the original data, however, some images using a ‘lightbox’ enlargement system don’t always load. I’m looking into this and hope to restore this functionality throughout in the coming weeks.


Something a little different but hopefully interesting to some.

Bitcoin Halving – 2024

At the time of writing the latest Bitcoin block is at height 839,523, just 477 blocks from the next halving of Bitcoin’s block reward. In theory this should be in 79 ½ hours’ time; around 01:59 on 20th April 2024 (UTC), but this is based on 10 minutes for each block. As discussed in my post Bitcoin Block Time Consistency, at that time the average (mean) block time from the genesis block was 9 minutes and 47 seconds which would result in the halving event occurring sooner.

The last difficulty adjustment was made at block 838,656 (21:17:33 10th April 2024) and the next won’t occur until block 840,672 which will be after the halving.

Since the last difficulty adjustment, the average block time has been 586 seconds, or 9 minutes and 46 seconds. Based on this trajectory the halving event should occur in 6,678 seconds earlier than the aforementioned time on 20th April 2024, approximately 12:08:47 on 20th April 2024.

Extending the block time analysis back until the beginning of the year, the block time has been surprisingly consistent, with an average of 586 seconds; the same as since the last difficulty adjustment.


So how does this compare to Satoshi’s intent? With a 10-minute block time, and the genesis block being timed at 06:15:05 on 3rd January 2009, the current halving would not be expected until 02:15:05 on 23rd December 2024. The Bitcoin blockchain is therefore approximately 247 ½ days ahead of the designed schedule.

Rewards for Bitcoin Miners

Back in February last year I wrote about Bitcoin’s block reward halving and when block rewards may reduce to zero based on the projection of block time (https://blockchainanalysis.co.uk/bitcoins-final-block-reward/). In that post I touched upon the requirement for transaction fees to reach a point where miners continue to be incentivised to mine despite low or no block rewards. At the time of writing we are at block 825303 and the next block halving event is at block 840000 (14697 blocks time / around 100 days) and therefore I’ve been revisiting the data with this in mind.


Between 2009 and 2015, transaction fees accounted for less than 1% of the miner’s rewards. From this point forward transactions fees have remained above 1%, peaking at an outlier in 2017 at 12.5%, I expect due to the bull market and limited/immature exchange options at that time. We have, however, seen an overall trend towards fees growing as a source of income for miners, something that will have to continue as the block rewards reduce.


The table below summarises the rewards afforded to miners since 2009 whilst the graph provides a visual representation of the same data (note the Y-Axis starts at 80% to better visualise the data).

YearBlock Rewards (BTC)Tx Fees (BTC)Total (BTC)Block Reward %Fee %
20091624450.002.871624452.87100.000.00
20103396000.0043.993396043.99100.000.00
20112981350.003086.522984436.5299.900.10
20122612225.006797.462619022.4699.740.26
20131585825.0015274.641601099.6499.050.95
20141471625.004636.571476261.5799.690.31
20151358025.008200.111366225.1199.400.60
20161045862.5022555.591068418.0997.892.11
2017699100.00100370.69799470.6987.4512.55
2018681225.0025704.82706929.8296.363.64
2019677900.0019787.71697687.7197.162.84
2020453318.7526309.78479628.5394.515.49
2021329287.5021461.93350749.4393.886.12
2022332425.005374.73337799.7398.411.59
2023337493.7523431.57360925.3293.516.49


As Bitcoin gains monetary value it continues to be more a store of value then a currency, I therefore do not expect that transaction fees will play a significant role as there are (relatively) few transactions taking place and more trades are handled by exchanges (which maintain their own ledger). The SEC’s approval of several Bitcoin spot ETFs will certainly contribute to this as ownership by institutions increases and, like exchanges, private ledgers track the ownership.

Bitcoin – Year in Review 2023

Despite the pessimism over the valuation of crypto over the year (“just” ~156% return for BTC), crypto has not been devoid of substantial events in 2023. The headlines have been dominated by the prosecution and conviction of Sam Bankman-Fried, and this story will continue into 2024 when he is sentenced.

November 2023 saw Binance founder and vocal crypto Changpeng Zhao (often known as ‘CZ’) step down as CEO and faced criminal charges in the US. He subsequently pleaded guilty to money laundering violations and will also be sentenced in 2024.

We witnessed the collapse of Silicon Valley Bank, a ‘crypto friendly’ bank, with ties to Circle who are responsible for the USDC resulting in the repegging of the stablecoin.

The introduction of Bitcoin ordinals also occurred, along with the debate whether it is good or bad for Bitcoin.

In more positive news for crypto, the long-running case of SEC v. Ripple Labs finally concluded with the court determining that XRP was not a not a security when sold on exchanges to retail investors. A major ruling in the crypto space and one which will undoubtedly be cited in future cases.

The positivity continued over the last few weeks of the year with the long-awaited Bitcoin ETF (Exchange Traded Fund) approval looking imminent. Several applications are with the SEC and the decision is expected in early January 2024.


But how did Bitcoin perform over the year?

In 2023 there were 153,415,993 transactions (141,472,918 SegWit and 1,1943,075 non-SegWit) contained in 53999 blocks. This led to an increase of 71,730,195 in UTXOs (Unspent Transaction Outputs). The average block time was 584 seconds (9 minutes and 44 seconds). Miners were awarded 360,925.31 BTC over the year, consisting of 337,493.75 BTC in block rewards and 23,431.57 in fees. The largest fee paid was in block 818087 when a fee of 83.65 BTC was paid to send 55.77 BTC.


How did this compare to 2022?

In 2022 there were 9,3106,378 transactions in 53188 blocks leading to an increase of 7,469,033 UTXOs. The average block time was 593 seconds (9 minutes 53 seconds). Miners were awarded 337,799.73 BTC (332,425 BTC in block rewards and 5,374.73 BTC in fees). The largest fee paid was in block 767482 when a fee of 3.45 BTC to send just 0.27 BTC.


With big events coming early in 2024 it promises to be another action filled year for Bitcoin and the crypto community as a whole.

Bitcoin Fees

Bitcoin is frequently criticised for having high transaction fees but this month saw Paxos pay a fee over $500,000 for a transaction of a mere $2,000 in BTC. Fortunately for Paxos, F2Pool, the miner of block 807,057 which contained the transaction acknowledged the error and agreed to refund the fees in full a few days later in block 807,732.

It just goes to show that no matter whether you’re new to crypto or are in the business costly mistakes can happen.


But is this the largest fee paid for any transaction in Bitcoin’s history? In terms of BTC no, that honour goes to a transaction in 2016 when a fee of over 291 BTC was paid to transfer a mere 0.0001 BTC! Around this time BTC was around $460, therefore this fee was worth approximately $133,860; all to transfer just 50c in Bitcoin.


Over the course of Bitcoin’s history there has been four transactions with fees higher than 100 BTC, the previously mentioned example as well as one on the 12th December 2011 (block 157235; fee almost 172 BTC), another on 10th January 2013 (block 215936; fee 111 BTC) and 28th August 2013 (block 254642; 200 BTC).


The table below provides the highest fees paid per year since Bitcoin’s genesis block.

2010201120122013201420152016
4.32171.7967.5020027.7285.89291.24
2017201820192020202120222023 (Partial)
504.701.993.491.833.4519.82
All fees are in BTC

How are Ordinals impacting the transaction per second rate?

Since the introduction of Ordinals onto the Bitcoin network in January 2023 there has been criticism of them clogging up the network and resulting in higher fees for users. Large image files are often shown as examples of taking the majority of the size of a block but there are a large number of text based ordinals which consume significantly less space.

I consider the transactions per second throughput of the Bitcoin network from 2021 to the present to establish if ordinals were impacting the network.


Originally I intended only to consider 2022 and 2023 but on an initial review of the data the results were unexpected; the throughput was greater in 2023 despite ordinals being introduced. This is discussed later.


Mean Transactions Per Second

Month202120222023
January13.778.588.63
February13.417.9610.27
March14.958.5912.31
April13.129.3614.97
May10.578.8231.17 (Partial)
June9.848.73
July6.337.90
August7.128.41
September9.478.93
October8.907.42
November8.648.91
December8.728.86

Median Transactions Per Second

Month202120222023
January4.702.993.39
February4.713.104.05
March4.243.144.41
April4.053.174.97
May3.473.219.62 (Partial)
June2.853.12
July2.652.94
August2.822.98
September3.003.10
October3.253.08
November3.333.39
December3.183.17

To my surprise, the transactions per second have increased, on average, since the introduction of ordinals onto the Bitcoin network when compared to the same months in 2022. I extended my analysis to include 2021 to establish if this was consistent behaviour. The figures between 2023 and 2021 were more similar to that of 2022. I suggest that this is due to the bull market of 2021 vs the bear market of 2022 resulting in there being significantly fewer transactions on the network in 2022.

Reviewing the mempool transaction account chart on Blockchain.info lends support to this.


Considering the results, the conclusion appears to be that ordinals haven’t negatively impacted the transactions per second throughput of the Bitcoin network, however, it must be considered that this is during a bear market. If the ordinals remain popular during the next bull market where transaction volumes increase there is a realistic prospect of the network becoming saturated leading to higher transaction fees and longer waits for users before transactions are included in a block.


Note the above figures are based on inverting negative time values where a higher block is timestamped before the previous block. This is discussed in more detail in https://blockchainanalysis.co.uk/bitcoin-transactions-per-second-tps/. Furthermore, this is based on the embedded timestamps within the blocks which may not be accurate; see https://blockchainanalysis.co.uk/bitcoin-block-time-consistency/

Bitcoin RPC Genesis Block Oddity

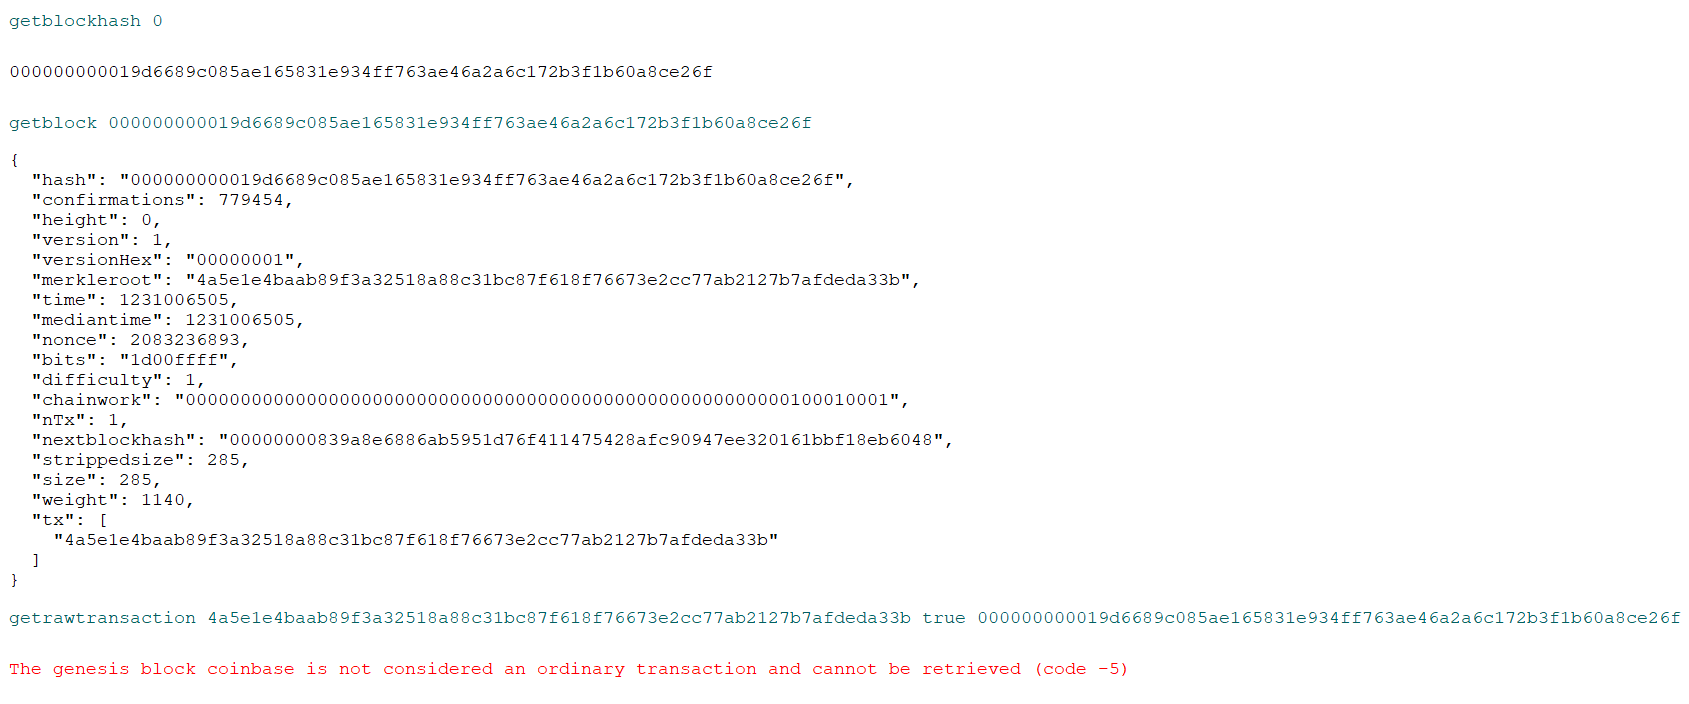
Much of my research is based on commands to which Bitcoin Core RPC server responds. Through playing with the RPC server I noticed an odd quirk in it concerning the genesis block.

The genesis block can be requested with ‘getblockhash’ 0, returning the block hash 000000000019d6689c085ae165831e934ff763ae46a2a6c172b3f1b60a8ce26f which in turn can be requested with ‘getblock’ or ‘getblockheader’ which correctly returns the block information, and the former provides the single transaction hash present in the genesis block; 4a5e1e4baab89f3a32518a88c31bc87f618f76673e2cc77ab2127b7afdeda33b.

On any other transaction the command ‘getrawtransaction’ can be used on a transaction hash to expose the raw transaction data but for the genesis block transaction, the server responds to this command with ‘The genesis block coinbase is not considered an ordinary transaction and cannot be retrieved (code -5)’.

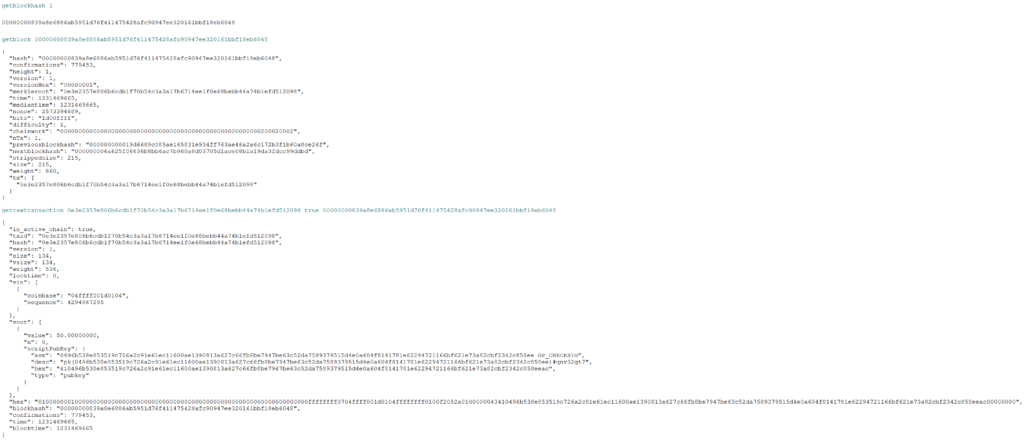
The image below shows the query log of the genesis transaction vs that seen in the second block.

Nonce Exhaustion

I’m currently working through data stored on the Bitcoin blockchain for a future post. In doing so, I was surprised by the amount of seemingly random or meaningless data within Coinbase transactions. The obvious reason for this may be a type of encoding I am not familiar with, but these encodings often exhibit patterns which weren’t observed in many instances.

I researched potential reasons for this seemingly random data and I found in Andreas Antonopoulos’ excellent book ‘Mastering Bitcoin’ a discussion of Bitcoin’s nonce being insufficient to facilitate modern hash rates in combination with Bitcoin’s timestamp only being to 1 second precision.


The nonce is part of the Bitcoin block header which is intended to be modified by miners when mining to create a hash lower than the difficulty target. This is stored within the Bitcoin block header as a 4-byte (32 bit) value. 4-bytes allow for 4,294,967,296 unique combinations. Therefore a hash rate of ~4.3GH/s could exhaust the nonce possibilities within the 1 second before the timestamp could be updated.

In the early days of Bitcoin mining using CPUs hash rates were typically measured in MH/s (for example bitcoin.it reports an Intel Core i7 3930K – 6 core, 12 threads – achieving 66.6MH/s, or around 0.07GH/s) and were not close to exhausting the nonce possibilities within 1 second (it would take just over a minute). The move to GPU (Graphic Processing Units) did improve hash rates significantly, but they typically were still measured in MH/s. My trusty AMD Radeon 5850 I mined my first bitcoin on is reported to be around 430MH/s (~0.4GH/s) which from memory is about right. This would mean exhausting the 4-byte nonce would take around 10 seconds).

Then came ASICs (Application Specific Integrated Circuits). These specifically designed chips quickly pushed the GH/s barrier. Bitmain’s Antminer S1, first introduced in 2013, was advertised as achieving 180GH/s which would exhaust the 4-byte nonce in approximately 20ms. If the nonce was the only element which the miner could change, the miner would idle 98% of the time waiting for the next second to ‘tick over’.

Even my Gekkoscience Compac which is equipped with a single Bitmain BM1384 ASIC chip achieved around 11GH/s whilst only being powered by a USB port would be capable of exhausting the nonce in around 400ms.

For reference, Bitmain’s highest performance miner currently listed on their website is S19 Pro+ Hyd which is advertised as achieving 191TH/s (191000GH/s), over 1000 times quicker than the original S1, or over 17000 times quicker than my Gekkoscience Compac (although using 1750 times the power!).

To accommodate increasing hash rates beyond 4.3GH/s miners had to find other elements of the block to change to generate a different candidate hash value to compare to the target. Within the Block Header are the following six elements:

NameSize (Bytes)Description
Version4The version of block validation rules used
Previous Block Header Hash32The hash of the previous block header
Merkle Root Hash32The hash of the all transactions within the candidate block
Time4The time the of the candidate block
Nbits4The difficulty target
Nonce4A modifiable field used to achieve a hash below the difficulty target

The Previous Block Header Hash and the nBits fields cannot be modified as the former would break the connection with the previous block whilst the latter would rule the block invalid as the target wouldn’t pass validation. The remainder are, however, modifiable to varying degrees. The Time and Version fields need to meet certain acceptance criteria and therefore the full range of values is not available to the miner.

This therefore leaves limited scope to accommodate the high hash rates of modern ASIC miners and ultimately leaves the Merkle Rook Hash to be changed. This cannot be modified directly (as the hash would not match the transactions present in the block), but the transactions can be modified to ensure the hash changes. An easy method of changing the transactions, without adding extra fees, is the modification of the Coinbase transaction essentially using the unlocking script field (ScriptSig) as an extra nonce, explaining the seemingly random data observed.

SegWit Adoption

In the previous post I touched upon SegWit and how it was used to fit almost 4MB of data within the 1MB block size limit present in Bitcoin.


SegWit was introduced to the Bitcoin network in 2017 and removed (segregated) the witness data from the transactions’ inputs and moved them to a separate structure within the blockchain. This had the effect of reducing the block size requirements for transactions (and therefore the often the transaction costs) and protecting against transaction malleability.

The move also brought in a means to increase the storage potential as seen in the previous post relating to ordinals of around 3.9MB being stored on chain. This is due to a move from bytes to Work Units (wu) for calculating the size. Since the SegWit update, blocks are limited to 4 million weight units, with 1 byte in a legacy transaction being 4wu, but 1 byte in a SegWit transaction being 1wu.

Native SegWit addresses can be identified as starting bc1 on the mainnet, or tb1 for the test net. P2SH (Pay to Script Hash) addresses can also be used for SegWit transactions which start with ‘3’.

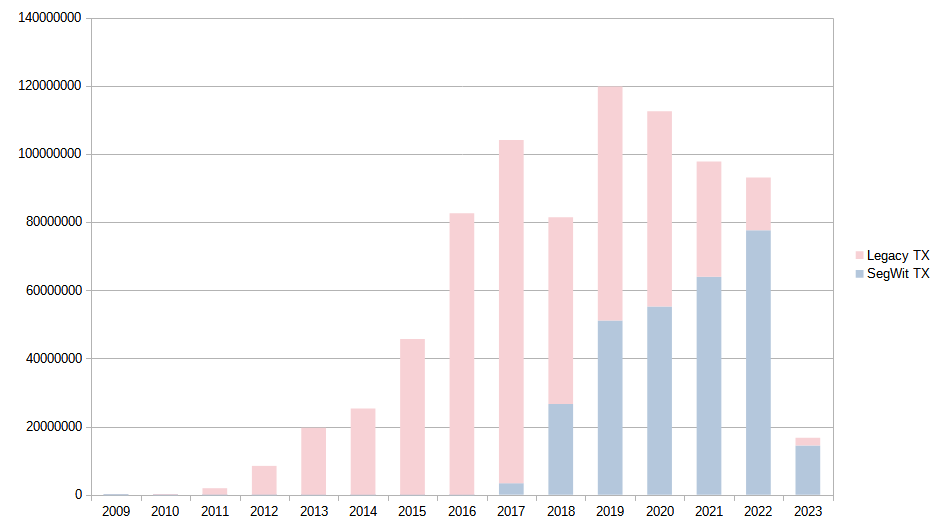
The adoption of SegWit for transactions appears pretty rapid, perhaps not unexpected given the savings made in fees by users. In 2018, approximately 1/3rd of transactions used SegWit. By 2019 this was around 43% and by 2022 approximately 87% of transactions used SegWit. Impressively, in 2023 SegWit usage appears to continue to rise with 86.5% of transactions using SegWit.


The table below summarises the quantity and percentage of SegWit transactions each year.

YearNo of
SegWit

Transactions
No of Legacy
Transaction
s
Total No of
Transactions
Percentage
SegWit
Percentage
Normal
2009032708327080100.00
201001853051853050100.00
20110190176519017650100.00
20120845305084530500100.00
2013019643241196432410100.00
2014025263720252637200100.00
2015045674023456740230100.00
2016082626623826266230100.00
201733742151006890141040632293.2496.76
201826599771547958658139563632.6867.32
2019510861026869754511978364742.6557.35
2020551791305737436811255349849.0250.98
202163919480338769739779645365.3634.64
202277594859155115199310637883.3416.66
20231444662522544831670110886.5013.50

Bitcoin Block Size

In my previous post (Bitcoin – Transactions Per Second (TPS)) I used data from Bitcoin Visuals’ website (bitcoinvisuals.com) to identify the average Bitcoin transaction size in recent years.

Since writing that post I have found that the Bitcoin RPC server responds to the ‘getblockstats‘ command. The response includes various parameters including:

  • ‘avgtxsize’ – the mean average transaction size within the requested block
  • ‘maxtxsize’ – the maximum transaction size within the requested block
  • ‘mediantxsize’ – the median average transaction size within the requested block
  • ‘mintxsize’ – the minimum transaction size within the requested block
  • ‘swtotal_size’ – the total size of all segwit transactions within the requested blockchain
  • ‘total_size’ – the total size of all non-coinbase transactions

By using this command we can easily identify the typical size of transactions on the Bitcoin network.


The (mean) average transaction size since the genesis block is around 590 bytes, and the (mean) average of the block median transaction sizes is around 265 bytes suggesting that relatively few very large transactions are responsible for skewing the mean average.

Without additional information as to each transaction’s size which, as far as I’m currently aware, would require querying each individual transaction it is difficult to identify these outliers. The ‘getblockstats‘ command does, however, expose the maximum transaction size for each block.

Earlier this year, on 1st February 2023, the Bitcoin network saw the largest ever single transaction in block ‘774628’. This transaction was a whopping 3938383 bytes (3.9MB) occupying the majority of the available block space. Some may have noticed that this exceeds the 1MB block size limit, however, this was a SegWit transaction therefore its contribution to the block size is not counted in the same manner.

Further investigation of this transaction found that it was related to Bitcoin ordinals and the reason for it being so large is the entire JFIF image is embedded within the witness data. The ordinal can be seen here.


As an aside, the transaction was large enough to crash Bitcoin Core’s ‘decoderawtransaction’ command. Fortunately, some of the online decoders (but not all!) managed to decode the transaction.


A further 2 transactions have been over 1000000 bytes, both in February 2023. These were blocks 776884 and 777945 and the large transactions were both related to ordinals(776884 and 777945).

Before 2023, the largest transaction was in 2015 when block 364292 contained a transaction just under 1MB in size. This appears to be very large due to the number of addresses (5569) all sending 1000 satoshis to a single Bitcoin address (transaction hash bb41a757f405890fb0f5856228e23b715702d714d59bf2b1feb70d8b2b4e3e08).


Getting back on track, the table below provides a summary of the average block sizes.

Year2009201020112012201320142015
Average TX Size10.13140.13445.42476.81526.36638.45794.79
Year2017201820192020202120222023 (partial)
Average TX Size622.29808.31533.21690.68867.07853.391309.37

This would give an approximate average TPS over the past few years of between 1.95 to 3.13 (2017 to 2022) based on the mean average transaction size, and each block being the target 10 minutes.

« Older posts